6.1 Freedom from Barriers
Barriers in soil limit root growth and the plant's
ability to exploit the available soil volume. As a result, crops may not
achieve their potential yield.
If root growth is confined to a soil horizon, two
fracture lines, or appears to be stunted or contorted, there is a strong
likelihood that the roots are experiencing a barrier to growth. Plants
with strong tap roots. such as canola and lupins, or the main root of
vines, will clearly highlight a structural problem should it exist, but
such impediments to root growth can also be due to chemical factors, such
as pH sodicity and toxicity.
Figure 1 - Quality
indicators of root growth
Source: A Cass - CRC for Soil & Land Management
|
Good Root Systems
|
Poor Root
Systems
|
|
A branching system of main roots
|
Horizontal in character-often
contorted
|
|
Growth extends over 0.5m in the soil
|
Growth is shallow and
clustered
|
|
Fine roots (<1 -2 mm) found
throughout
|
Fine roots are often lacking
or only in the surface soil
|
|
Fine roots are healthy
|
Fine roots may be dead
|
|
All roots are disease free on the
root surface.
|
Diseases may be observed
|
It is important to establish the barriers that exist
in both the surface and sub-soil and to manage their treatment in the
appropriate order.
Physical Barriers
As roots grow through the soil they encounter
resistance against which they apply pressure.
|
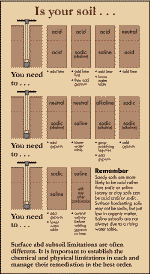
Figure 2 - Surface
and subsoil limitations are often different

(Click for larger image)
It is important to
establish the chemical and physical limitations in each layer and manage
their remediation in the best order.
Source: P Rengasamy - CRC for Soil & Land
Management, 1977
|
Maximum root pressure varies, but is limited to about
three mega Pascals (MPa) for vines and 5MPa for cereals. To put this in
perspective, your car tyres have about 2MPa pressure.
If a root encounters a soil with strength greater
than this, it will be unable to penetrate this soil and unable to extract
water and nutrients from it. Soil with high soil strength also requires
more power for cultivation.
Soil strength is highly dependent on soil water
content and bulk density. Soil is weakest when wet and uncompacted and
soil strength should be assessed when the soil is at field capacity, i.e.
one or two days after deep soaking rains.
Soil with poor structure, except sand, usually has
high soil strength. Poor structure may be naturally occurring due to the
nature of soil particle mix, but may also be due to the formation of
cultivation pans and traffic compaction or the degradation of organic
matter to the point where there are insufficient organic ‘glues’ to
hold the structure together.
Measuring Surface Soil Strength
This test should be carried out after good
soaking rains when the soil is at field capacity.
Push the sharpened point of a pencil into the
soil with the centre of the palm of the hand. If the pencil enters easily
without inflicting any pain on the palm of the hand, then the soil
strength is less than 1MPa.
If the pencil moves in the soil but causes pain,
the soil strength is between 1-3MPa. If the pencil moves into the soil
reluctantly, the soil strength is greater than 3MPa.
Interpretation of Soil Strength*:
*Note soil strength may be irrelevant if the soil
has many pores and cracks for roots to grow through.
Less than 1MPa - Roots and shoots will grow
through the soil without difficulty. Physical quality is good.
1MPa - 3MPa - seedling emergence will be
retarded and root growth may be restricted. If resistance is greater than
1MPa at field capacity, resistance is likely to increase to above 3MPa
before wilting point is reached. Root growth will be limited to periods
when the soil is wet, just after rainfall. Physical quality is moderate.
Above 3MPa - soil strength will limit root
growth most of the year and physical quality is poor.
Chemical Barriers
SALINITY
Saline soils are those, which have sufficient levels
of soluble salts in the root zone to adversely affect plant growth.
Salinity affects root growth in two ways: through direct toxic effects and
by increasing the osmotic pressure in the soil solution to a point where
plant roots can no longer absorb water. For the plant, the effect is the
same as if the soil were much drier. Different species have varying
tolerance to salt, but in many situations the concentrations of salt will
be too great for plants to survive (see Figure 3)
In arid areas there is insufficient rainwater to
leach the salts out of the root zone and salts accumulate as soil water
evaporates. Salinity also occurs where drainage is restricted, seepage
water gathers as it evaporates and an accumulation of salts is left
behind.
The salts present are mainly the cations sodium
(Na+), potassium (K+), calcium (Ca++) and magnesium (Mg++), as well as
associated anions such as chloride (Cl-), sulphate (SO42-), carbonate
(CO32-) and bicarbonate (HCO3-). Sodium chloride normally comprises about
two thirds or more of the total salt load, except if gypsum (CaSO4) has
been applied to the soil. Therefore, care needs to be taken in
interpreting salinity measurement if gypsum has been applied.
The degree of salinity can be assessed either by
observing the vegetation or by measuring the soluble salt content of the
soil.
Measuring Salinity
The concentration of salt in the soil is easily
measured and should be assessed for at least three layers in the top
metre. Salinity is measured by electrical conductivity (EC) either in soil
saturation extract (SE), or a mixture of one part of soil to five parts of
rainwater (1:5). The 1:5 method can be done in the paddock but the SE
method requires laboratory facilities.
Total soluble salt content is estimated from the
electrical conductivity (EC) of the soil solution.
Figure 3: A guide
to tolerance of plants to salty conditions
Source: Hi-Fert, Plant Nutrition and Soil Fertility, 1997
|
Salinity (max)
EC dSm
|
Ranking
|
Vegetables
|
Trees
|
|
0.5
|
Ultra Sensitive
|
|
Loquat
|
|
1.2
|
Sensitive
|
French beans
Strawberry
Peas
Turnip
|
Avocado
Banana
Walnut
|
|
1.4
|
Moderately Sensitive
|
Lettuce
Potato (sweet)
Pumpkin
Radish
Raspberry
|
Pear
Plum
Prune
Quince
|
|
2.2
|
Moderately Resistant
|
Broccoli
Cantaloupe
Carrot
Cauliflower
Cucumber
Gherkins
Onions
Potatoes
Sweet corn
|
Grape vines
|
|
2.8
|
Resistant
|
Artichoke
Tomato (furrow irrigated)
|
Fig
Olive
Pomegranate
|
|
3.5
|
Highly
Tolerant
|
Asparagus
Beetroot
Cabbage
Silverbeet
Spinach
Squash
Zucchini
|
Date Palm
|
|
5.0
|
Tolerant
|
|
|
|
Salinity (max)
EC dSm
|
Ranking
|
Ornamentals
|
Irrigated Crop or Pasture
|
|
0.5
|
Ultra Sensitive
|
Violets
|
|
|
1.2
|
Sensitive
|
Camellia
Dahlia
Fuchsia
Gladiolus
Poinsettia
Rose
Zinnia
|
Cowpea
Faba bean
|
|
1.4
|
Moderately Sensitive
|
Bougainvillea
Carnation
Coprosma
Hibiscus
Vinca
|
Flax
Maize
Sugarcane
Sub clover
White clover
|
|
2.2
|
Moderately Resistant
|
Chrysanthemum
Oleander
Stock
|
Cocksfoot
Peanut
Rice
Strawberry clover
|
|
2.8
|
Resistant
|
|
Lucerne
|
|
3.5
|
Highly
Tolerant
|
|
Fodder crops
Perennial ryegrass
Safflower
Sorghum
Soybean
Sugarbeet
Wheat
|
|
5.0
|
Tolerant
|
|
Bermuda grass
Barley
Cotton
Prairie grass
Puccinella
Salt water couch
Seashore Paspalum Trefoil, birds foot
|
-
Dry the soil samples on clean plastic under
cover. If gravel is present, sieve the air-dried soil with a 2mm sieve.
-
Add 20ml of soil to 100ml of distilled or
rainwater in a jar and mix by shaking periodically over one hour.
-
Allow the mixture to stand for half an hour
or until the suspension is clear. If the suspension does not clear EC can
still be measured but the reading will be overestimated by 0.01 to
0.03dS/m.
-
Calibrate
the conductivity meter with a standard solution standard solution,
then rinse the electrodes in rainwater and dry by gently touching with
clean tissue.
-
Take a reading in the suspension above the
soil, ensuring that the electrodes are completely covered.
When the results are more than 0.5dS/m (sands),
0.7dS/m (loams) or 1.0dS/m (clays), the saturation extract method should
be used. This method provides the only reliable assessment of soil
salinity. Values of more than 8dS/m in surface soils and more than 16dS/m
in sub-soils are limiting for most field crop and pasture species. For
horticultural plants, the critical value is as low as 2dS/m.
SODICITY
Sodicity is a naturally occurring problem in soils
that contain a high level of sodium relative to calcium and magnesium.
Although it is chemically induced, the result is the formation of poor
physical properties that cause barriers to seedling emergence or root
growth.
|
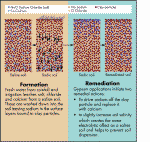
Figure 4: The formation of a sodic soil.

Source: P Rengasamy – CRC for Soil & land Management
|
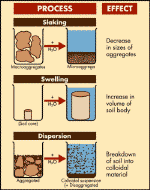
When in contact with water, a sodic soil will swell
and disperse into tiny clay particles that remain in suspension. On
drying, these particles block the soil pores resulting in surface crusting
or a hard setting layer in the soil horizon. These soils are often
susceptible to waterlogging, poor aeration and erosion and can present
barriers to root growth and seedling emergence.
Gypsum helps to ameliorate a sodic soil by replacing
sodium with calcium. Lime will also supply calcium and will raise soil pH,
which may be a beneficial side effect. Neither is very soluble and, for
best results, should be mixed into the soil by cultivation or ripping.
Frequently, sodicity is a problem with clay in the B
horizon, in this case, best results are obtained by ripping the horizon
when nearly dry and ‘blowing’ finely ground gypsum from a tube behind
the ripper. Air seeders with tynes spaced at 1m intervals have been used
successfully to do this.
Measuring Aggregate Stability and Sodicity
-
From each horizon sampled, select three
aggregates or fragments about the size of a pea. Carefully place them in a
shallow, clear container filled with enough rain or distilled water to
cover the spaced aggregates.
-
DO NOT MOVE THE CONTAINER. Carefully observe
the aggregates during the first few minutes and note whether they float on
the water or sink immediately. Then record if smaller aggregates detach
(slake) from the pea sized aggregate.
-
After two hours record whether slaking is
complete, partial or absent.
-
Leave the container undisturbed for 20 hours
and then assess dispersion (milky-ness in the water).
-
If NO dispersion occurred, take a handful of
soil and remove any gravel or plant fragments. Moisten with rainwater
whilst kneading into a ball of about 40mm diameter. Add small amounts of
water until the ball just sticks to the hand.
-
Break the ball open, remove three pea sized
balls and repeat step 1. Ignore steps 2 and 3, as slaking has no meaning
for moist artificial aggregates. Watch and record as for step 4.
Results - Slaking
-
Air-dried aggregates float - soil is
structurally stable, bulk density of aggregates is very low (less than
1g/cm3). Very good macrostructure quality.
-
Air-dried aggregates sink but do not slake -
soil is structurally stable, bulk density is greater than 1g/cm3. Good
soil macrostructure.
-
Air-dried aggregates sink and slake slowly -
unstable macrostructure on wetting. Organic matter is probably below
optimum. Tilled soil may set hard after rain. Reduced tillage should be
adopted and organic matter increased.
-
Air-dried aggregates sink and slake rapidly
- macrostructure is very unstable, organic matter is below optimum and
tilled soil will probably hard set after rain and/or crust badly, will
have poor infiltration and will cause runoff and probably erode if on a
slope. Reduced tillage should also be adopted and organic matter
increased.
Results - Dispersion
-
No dispersion after remoulding. Good
microstructure stability infiltration and water movement will be good.
-
Partial dispersion. The water will be partly
cloudy and partly clear. Poor clay stability. Gypsum should be applied as
above.
-
Complete or partial dispersion after
remoulding. Moderate clay stability. In the absence of careful management,
soil structure will deteriorate. Compaction, tillage pans and poor
infiltration may be problems under these conditions. Tillage in wet
conditions should be avoided.
-
Partial dispersion (dry aggregate) - the
water will be partly cloudy and partly clear. Poor clay stability. If left
without surface cover, the soil will ‘seal’ on the surface and cause
runoff and erosion on slopes. Gypsum should be applied.
-
Complete dispersion (dry aggregate) - Very
poor clay stability, the soil will ‘seal’, preventing infiltration
and, on slopes, will erode easily. Gypsum needs to be applied. Use a
laboratory test to determine how much gypsum should be applied.
|
Figure 5: The
effects of water on different soil particles

Source: Hi-Fert,
Plant Nutrition and Soil Fertility, 1997
|
SOIL CARBONATES
Calcium and magnesium carbonates are common and
important constituents of many South Australian soils. They take several
forms:
The amount and type of carbonate affect
They can also impact on crop and variety choice. For
example, soft carbonates affect the availability of some nutrient elements
and may cause lime-induced chlorosis in lupins and stone fruit, for
example. If present in large quantities, over 30%, the carbonate will
decrease soil permeability and restrict root growth.
Layers of sheet carbonate rock may prevent root
penetration and many carbonate nodules will limit the water holding
capacity of the soil, as the nodules do not hold water. Soil carbonates
are described in the field by noting the reaction to acid.
Measuring Carbonates
Hydrochloric acid of 1N concentration is used.
This can be approximately prepared by adding one part commercial Spirits
of Salts (HCl) to 10 parts rainwater. Add one or two drops of acid to a
soil sample and note the strength of the effervescence (caused by carbon
dioxide released by the acid-carbonate reaction). Use Figure
6 to interpret the results.
|
Figure
6: Interpreting the Fizz Test.
Soil carbonate can improve soil structure but above certain levels
will limit root growth.
|
|
Fizz Strength
|
Carbonate Content
|
Physical Effect Due to Carbonates
|
|
Not visible
|
Not calcareous
|
None due to carbonates
|
|
Just visible
|
Slightly calcareous
|
Positive effect on soil structure
|
|
Easily visible
|
Moderately calcareous
|
Becoming limiting
|
|
Strong
|
Highly calcareous
|
Restrictive to permeability and root growth
|
|
Very Strong
|
Very highly calcareous
|
Highly restrictive
|
(Source: A Cass – CRC for Soil & Land Management)
|
TOXIC ELEMENTS
Under some conditions, some elements can occur at
toxic concentrations.
Boron
is associated with certain types of clay, carbonate layers and rock
formations. Levels above 15ppm (soil test) are considered toxic and if
these levels occur within the potential root zone, damage to the root
system can be expected. The only solution is the use of tolerant
varieties.
Boron toxicity is associated with low rainfall
(<550mm per annum), alkaline and sodic sub-soils. It is a common
problem in many soils in South Australia.
Aluminium
is present in most soils, but only becomes available at very low pH, acid
conditions. It is commonly associated with soils developed on highly
weathered rocks.
Manganese,
like aluminium, may reach toxic levels in acid soils. This is because its
solubility is increased in acid soils
Sulphonylurea
Herbicides - In alkaline soils these group B herbicides have
been found to break down slowly, often leaving residues that affect
susceptible crops beyond the plant back period.
Biological Barriers
The damage caused to root systems by disease and
insect attack can be enormous. A stunted root system does not have the
capacity to fully explore the soil volume for the water and nutrients that
it needs. Recognition of disease and insect problems and their control
through appropriate rotations, tillage and spray programs are essential.
Barriers to Seedling Emergence
High and uniform emergence rates of seedlings
depend on a disease free surface soil, with adequate nutrition and a good
structure to allow adequate rain infiltration and satisfactory seed-soil
contact. The topsoil should be formed of stable aggregates to prevent
breakdown under rainfall and the formation of a crust.
Poor
surface structure can be a significant cause of patchy emergence.
Poorly structured surface soils can become hard and blocky after tillage.
Soils with the following features are likely to
create barriers to seedling emergence:
-
High proportions of fine sand and silt.
-
Sodium rich clay (even if the clay content is
as low as 10%).
-
Organic carbon content in loamy-clay soils of
less than 1%.
Water repellence is also a cause of uneven emergence and low
germination rates. Water repellence, most commonly found in sandy soils,
is caused by the accumulation of waxes on the surface of soil particles.
These waxes are produced by the decomposition of specific types of organic
matter, often from native vegetation, although some fungi and organic
matter from undigested fibrous foods deposited in faeces can also cause a
build up of waxes. Cereals do not breakdown to release these waxes and a
cropping phase has been found to reduce non-wetting properties over time.

6.1 Freedom from Barriers
[ Next ]
|
